What's the impact of a Youtube video on the page load time?
Published on: July 19, 2018 by Joona Tuunanen
It’s not uncommon to see videos embedded into other content on sites, especially on ecommerce and different types of blogs and media publications. But have you ever considered what’s the page speed impact of embedding a Youtube video to a page?
One way to dig into this is by using a combination of request blocking and the performance panel in Chrome Devtools. In this example let’s take a look at one of Apple Insider’s product review page that has an embedded Youtube video.
Figuring out the impact
To have any kind of idea what kind of an impact a change has, you of course need to have a baseline set. So let’s get the baseline numbers.
Pop Developer Tools open and navigate to the “Performance” panel there. Once it’s open, click on the “Start profiling and reload page”-button on the upper left corner of the Devtools window. After that you’ll see something like this:
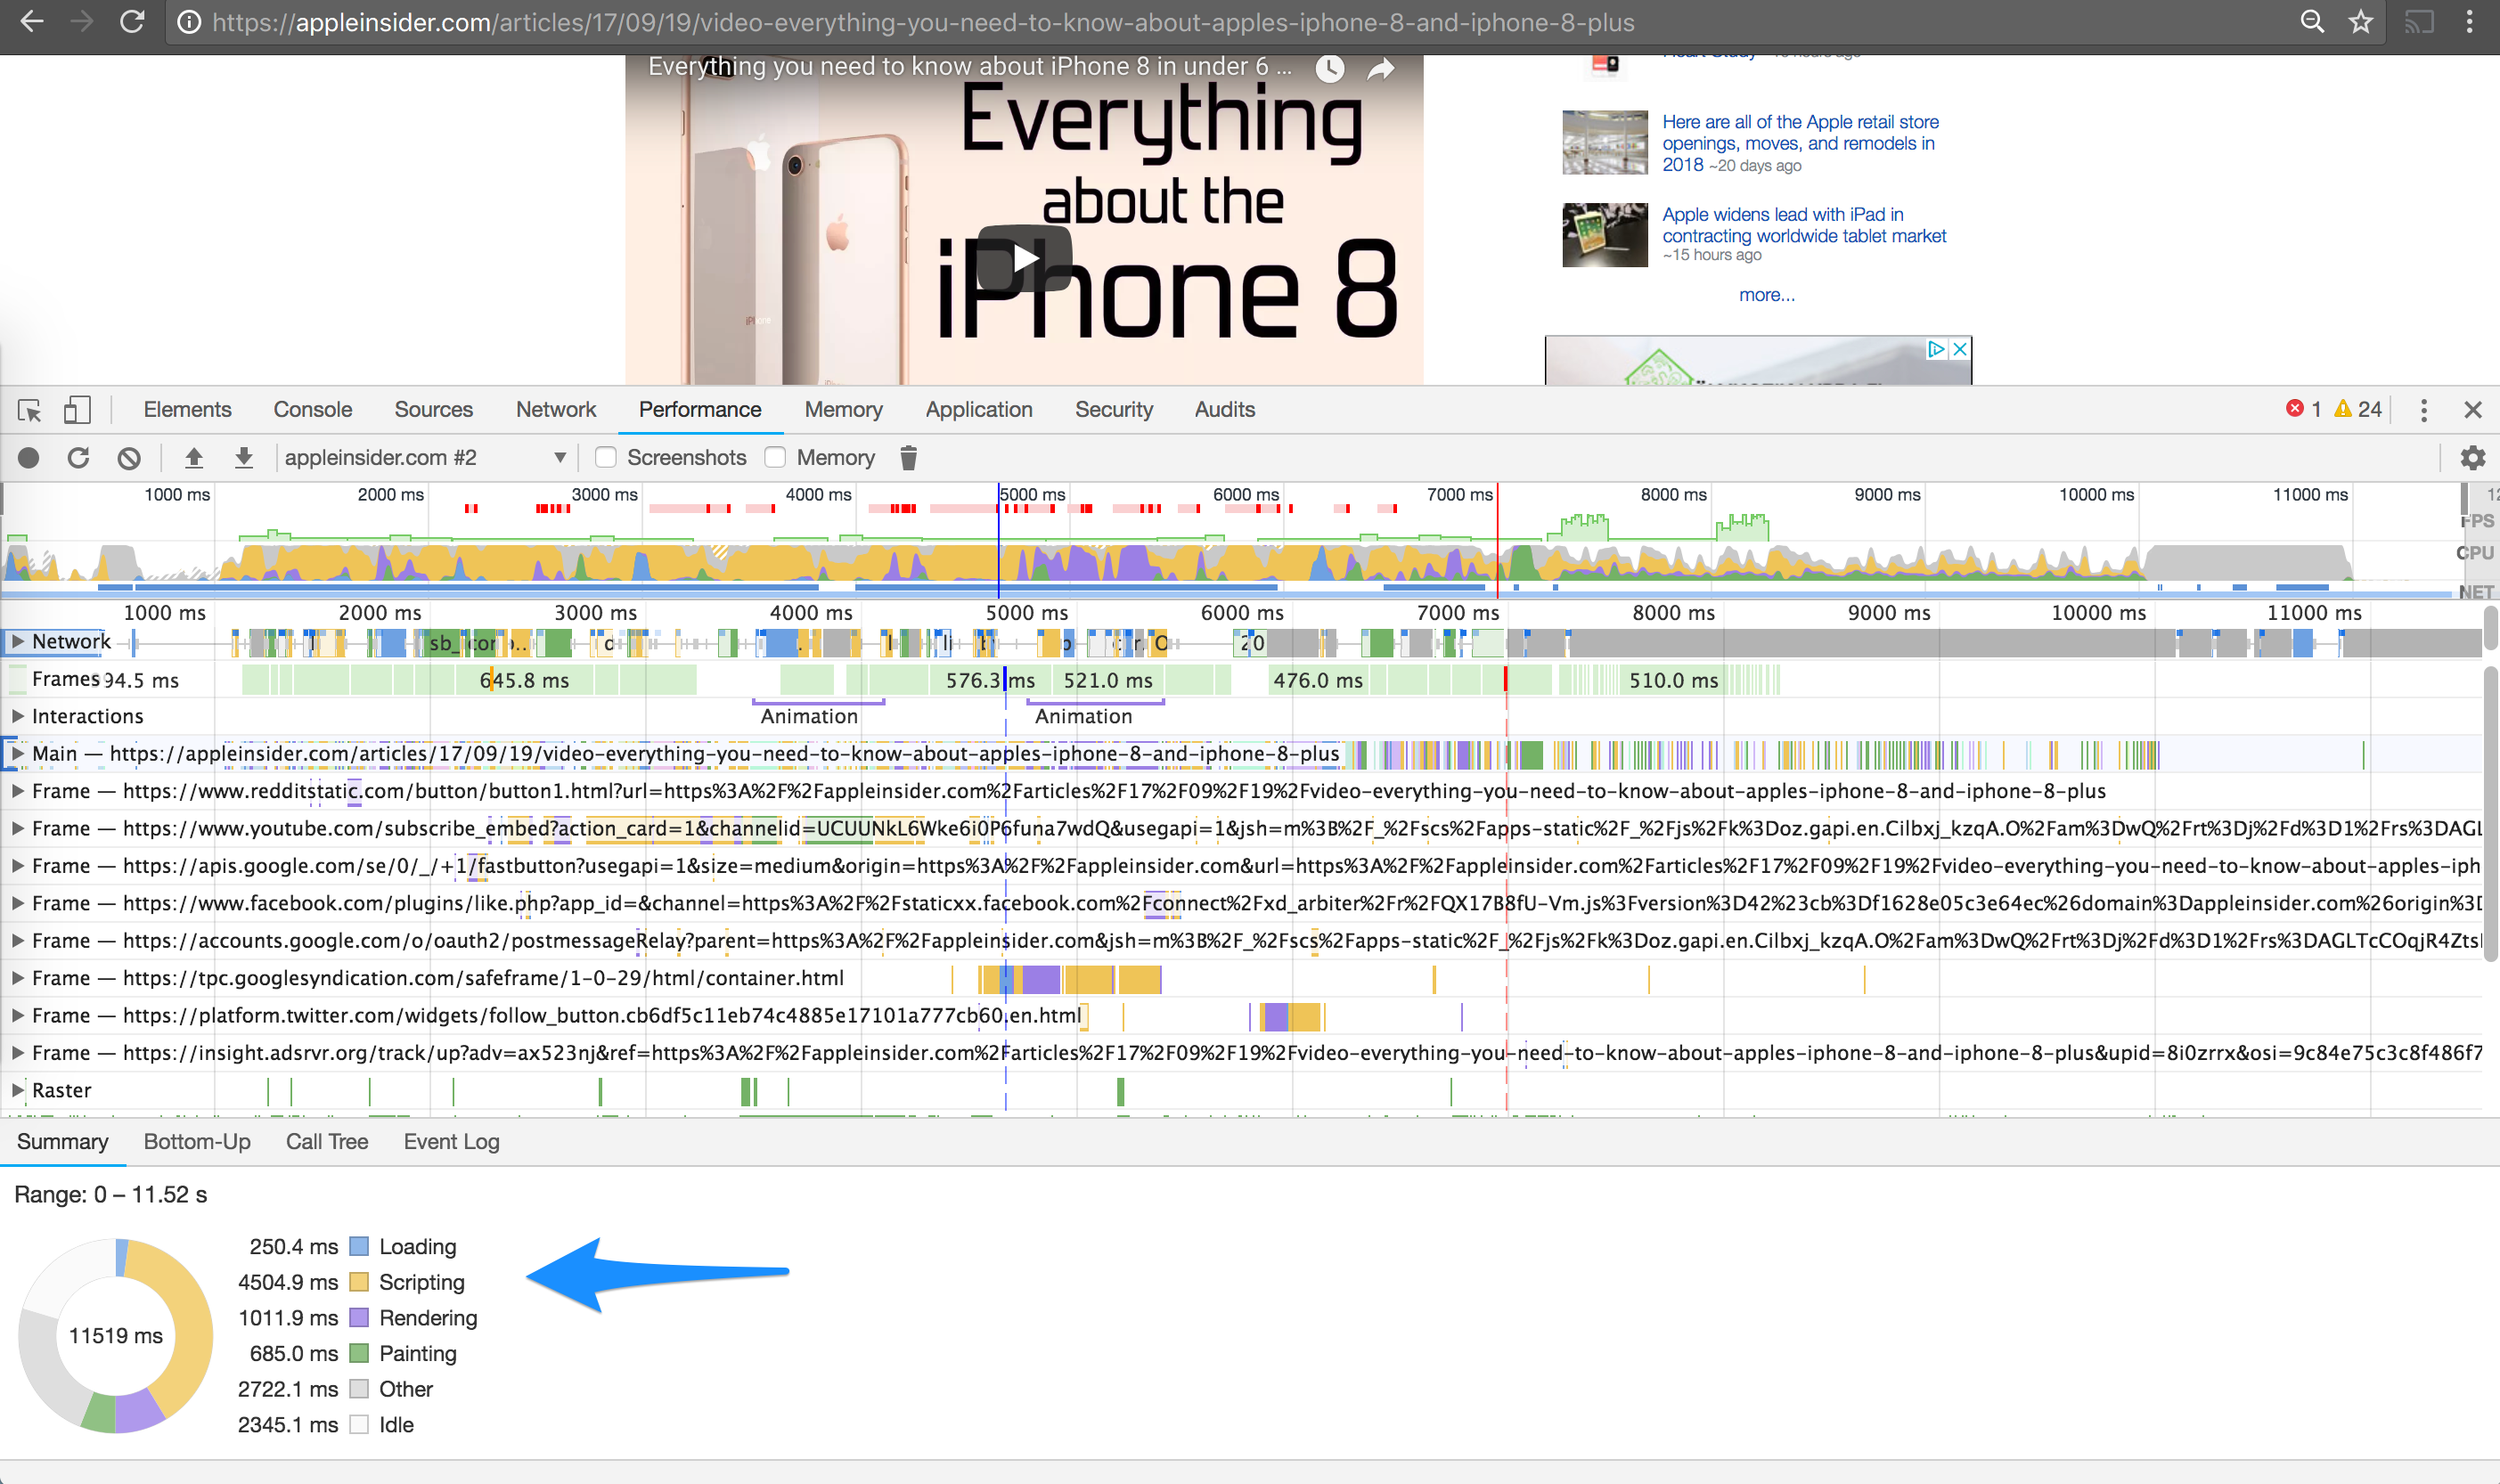
Yep, that is messy and quite scary looking. But let’s not focus on that at the moment. Instead, check out the graph on the bottom of the page.
That graph shows you how the browser resources were split between different parts of loading the page. In this example you see a lot of time (4504.9ms) going to scripting of the page, while quite a significant portion of the time also went to other or idle.
So this graph gives an idea that handling all the scripts, including those by Youtube, make a big part of the whole pie.
What would happen if we’d block Youtube from the sources, thus eliminating all those scripts from loading? Let’s find out.
To do that, you should click on the 3 dots on the upper right corner of the Chrome Developer Tools window, hover over “More tools” and then choose “Request blocking” on the menu.
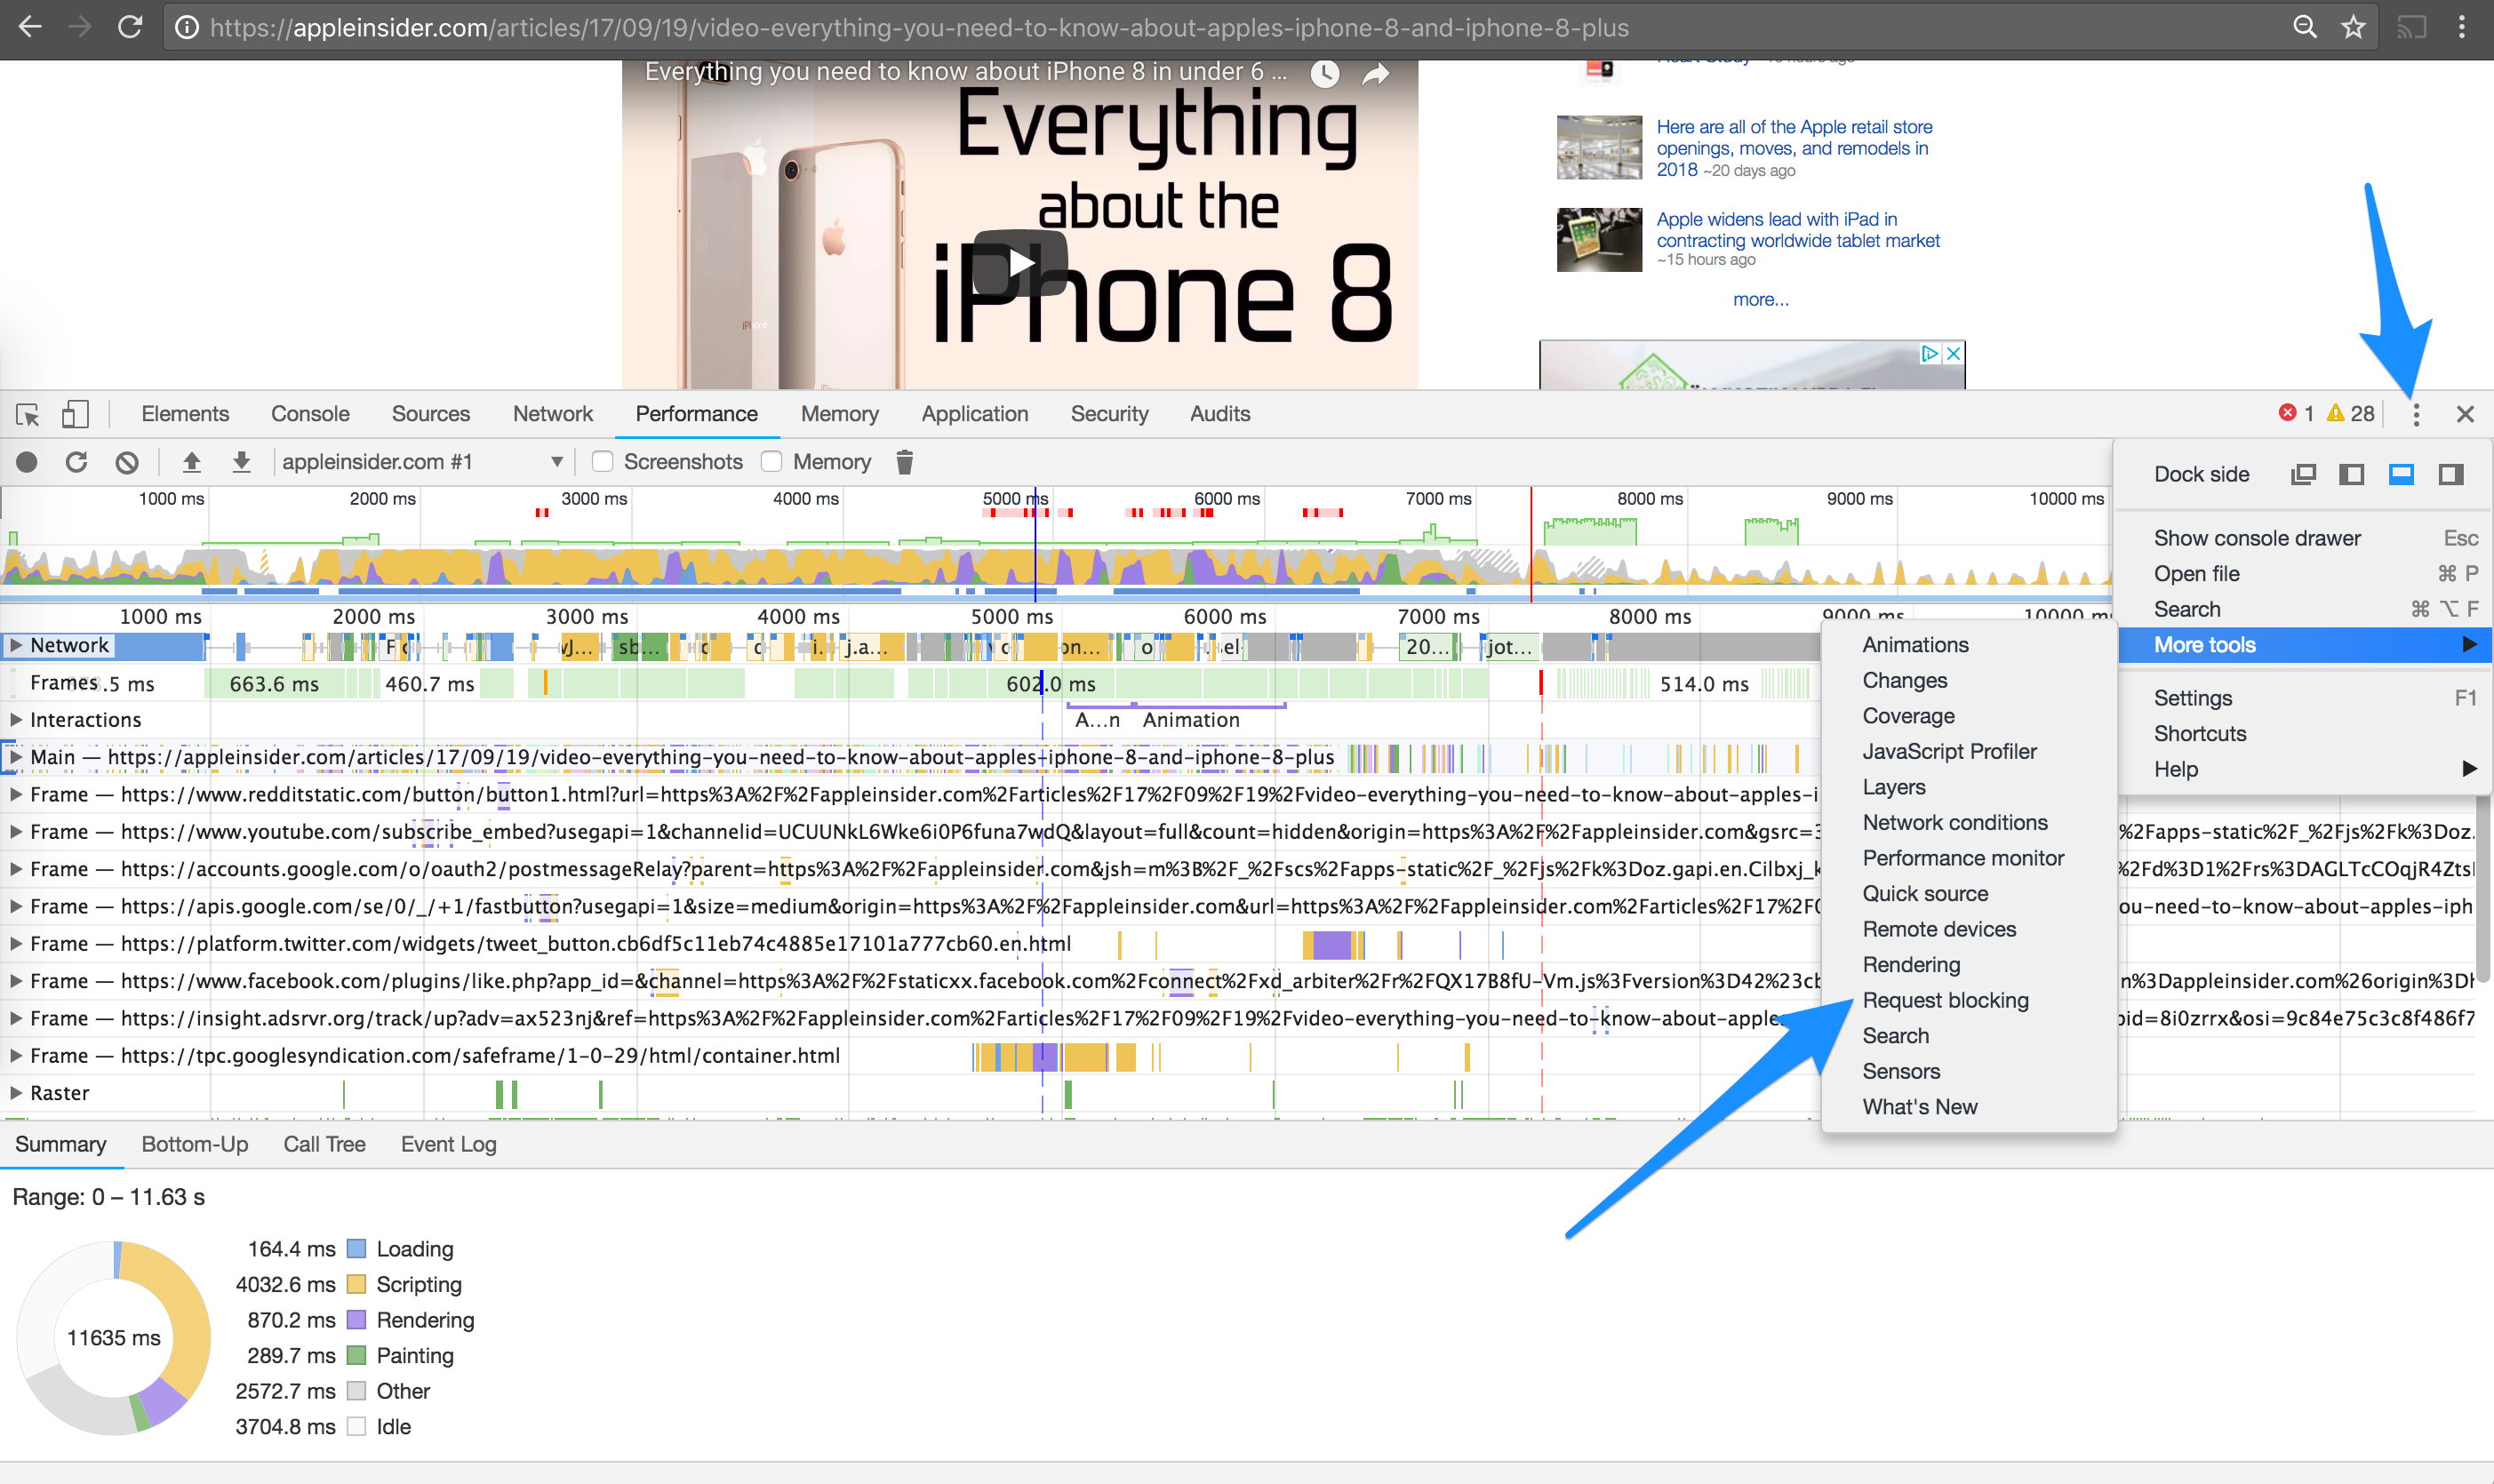
That will open another pane on the bottom of the Devtools window which allows you to add domains to be blocked. Once you’ve added the domain you want to block and clicked the “Enable resource blocking” box, you’re more or less ready to proceed.
Just click on the “Start profiling and reload page”-button again and let the browser do it’s thing. After that you’ll see something like this.
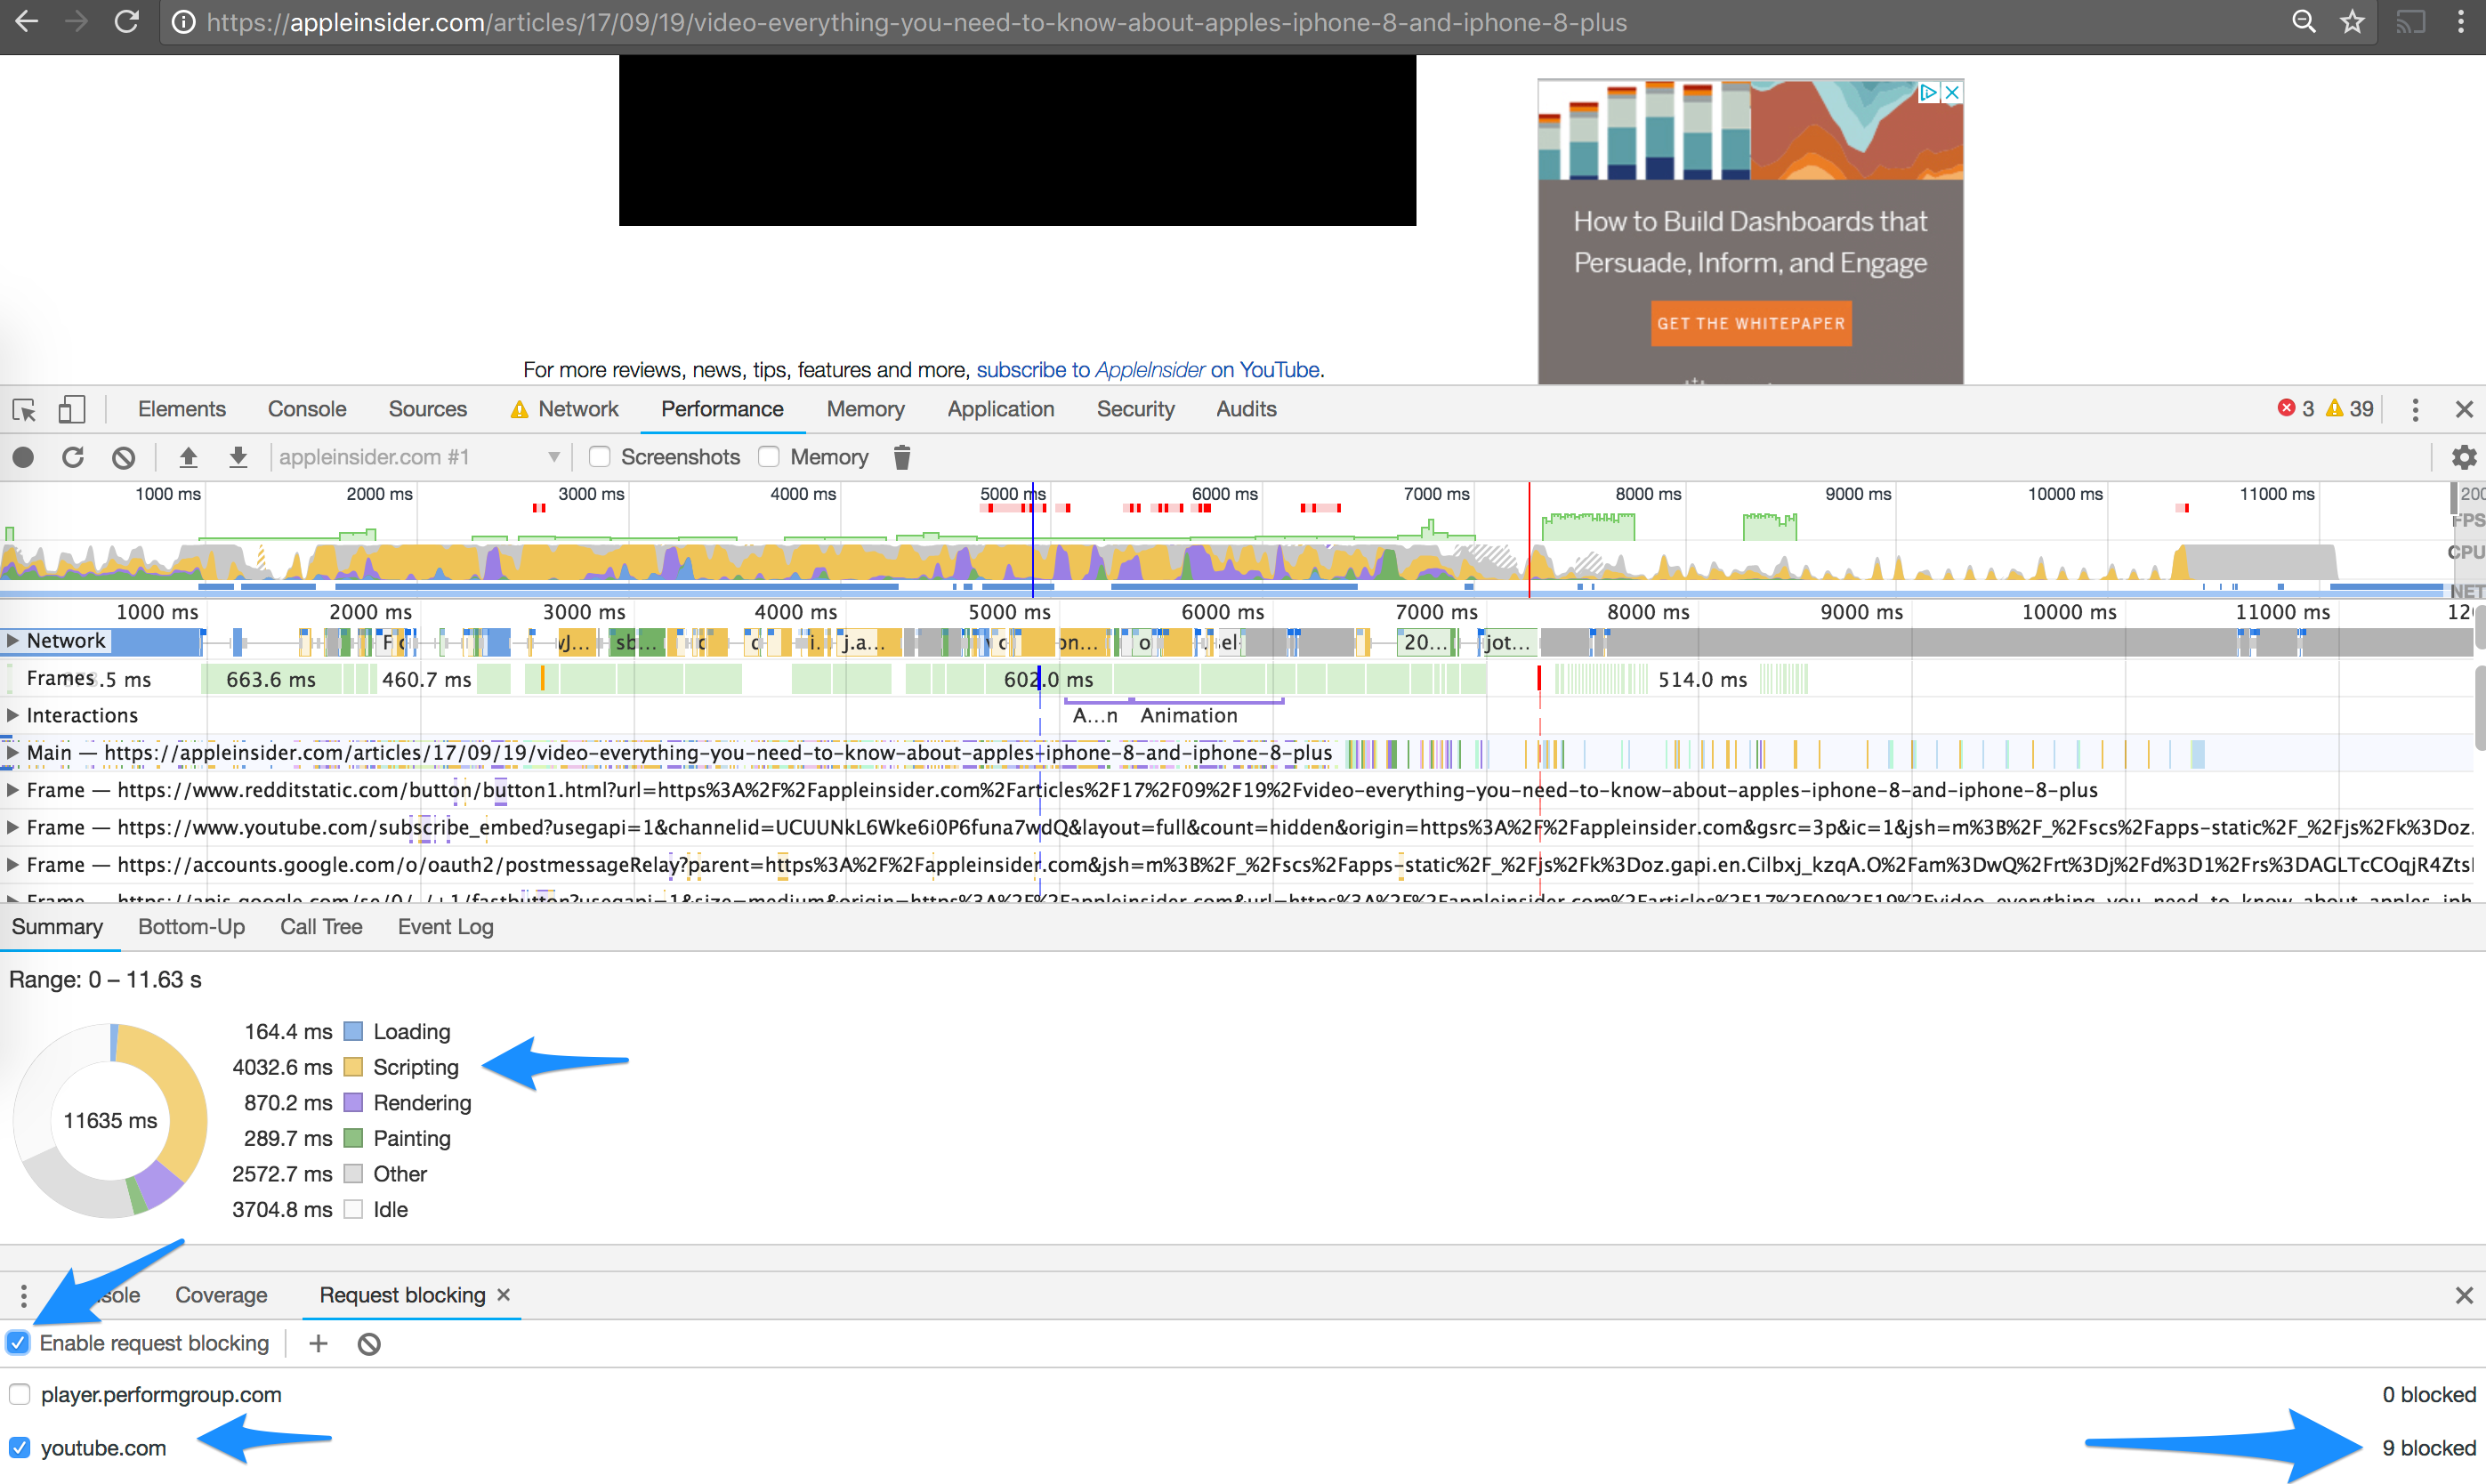
The screenshot above highlights the amount of blocked resources (9 in this case) for Youtube and shows the same graph than our previous baseline graph did.
If you compare the pie charts between our baseline profile and the one with Youtube blocked, you’ll see that our scripting time went down from 4504ms to 4032ms and rendering time from 1011ms to 870ms. Simple math tells you that for this particular site with my setup, removing Youtube scripts saved approximately 600ms of computing time.
And if you want to check the impact on the Network panel, that’s easy as well. Just hop on there and do the same thing with baseline and requests blocked.
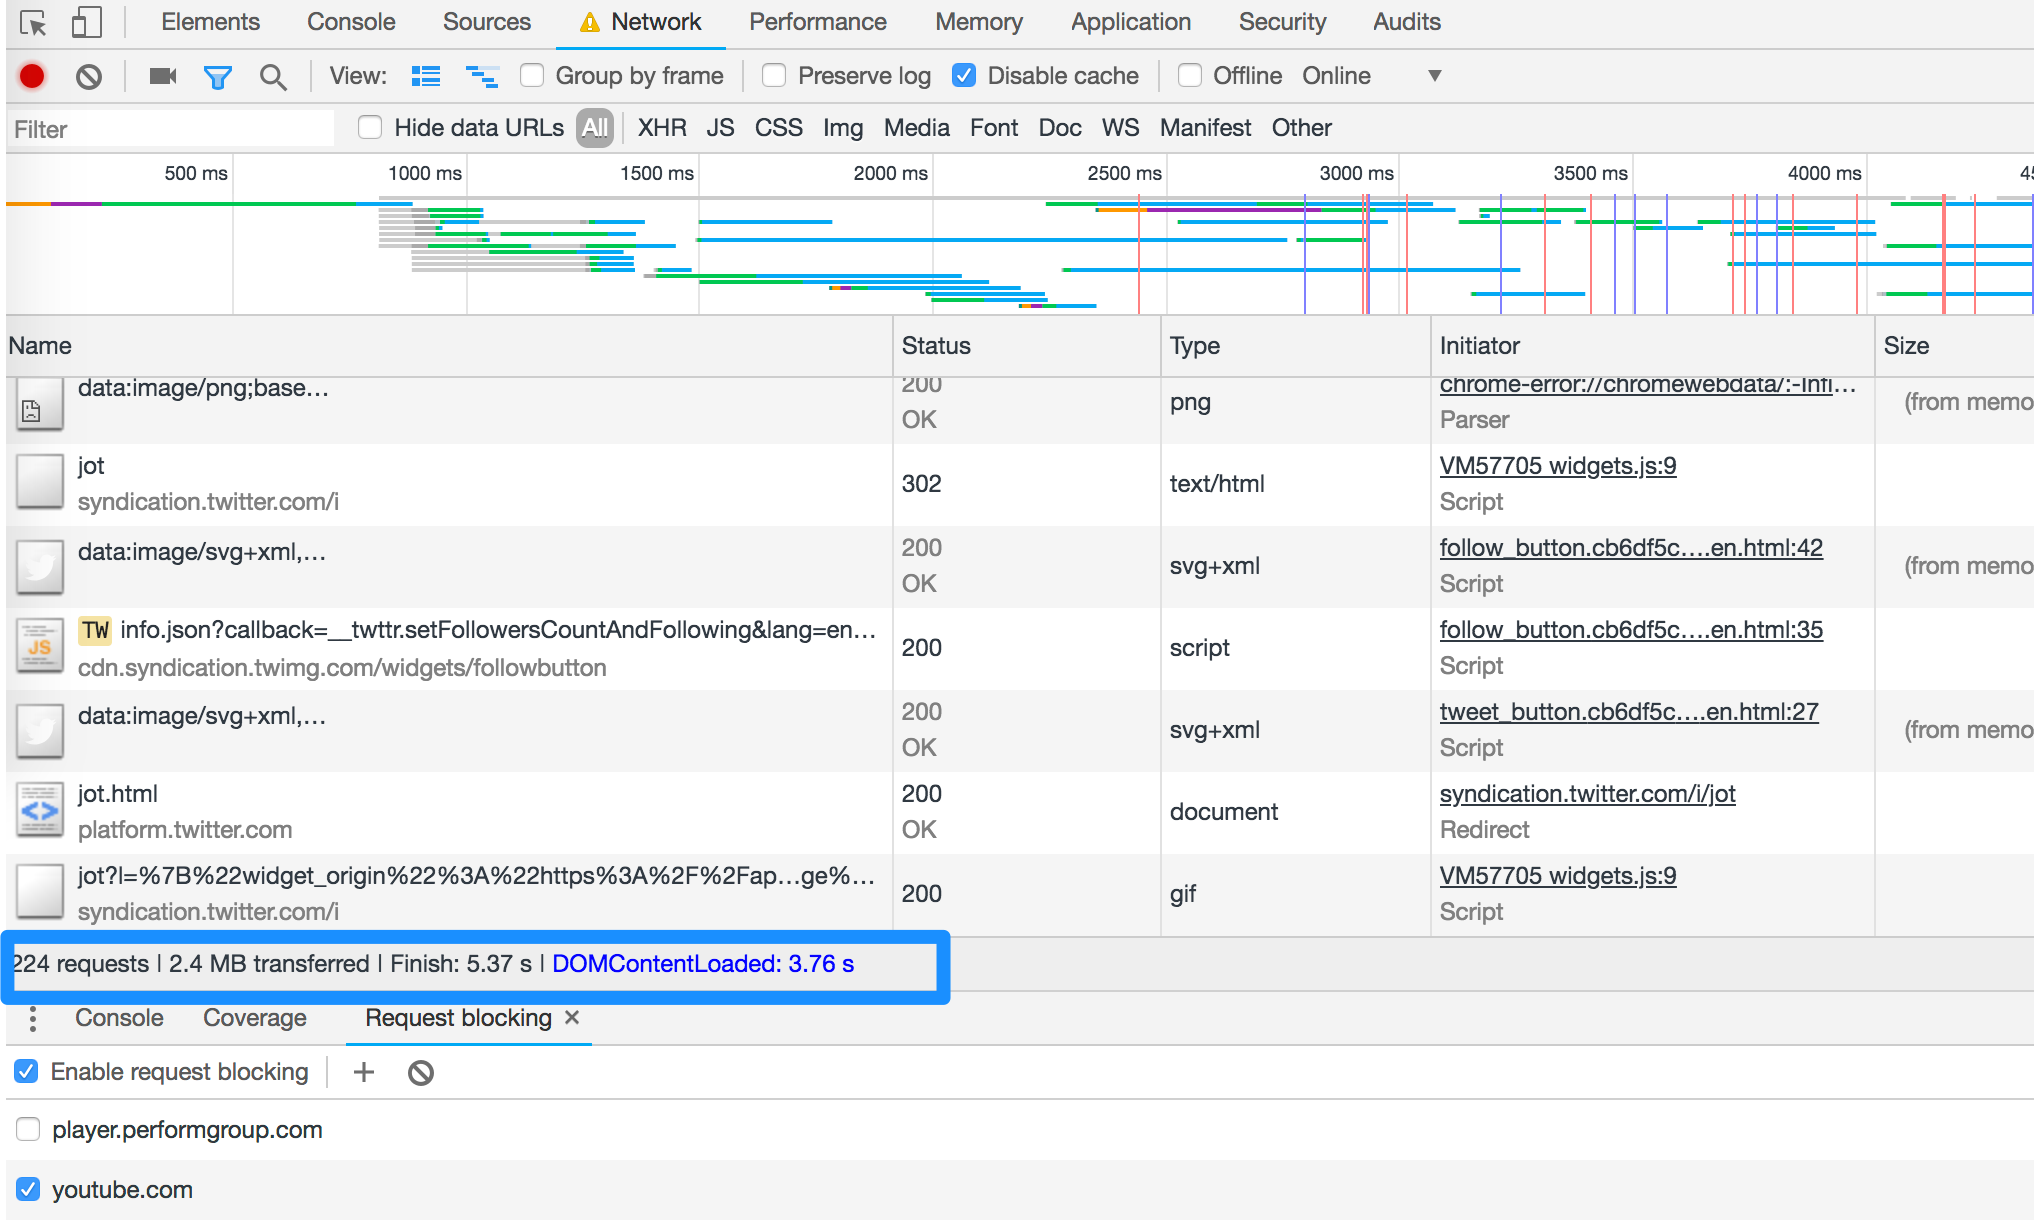
Based on the data what I got from doing this a couple of times, I saw a decrease of transferred files go from approx 3.5MB to 2.4MB and cutting the amount of requests from 270ish to 220ish. DOMContentLoaded was about 0.5s quicker.
What to keep in mind when analysing the data
It is quite easy to check how blocking a source of scripts or other resources would impact on the page load time. You can use the request blocking feature in Google Chrome Developer Tools for that.
While request blocking is easy, it’s not quite as easy to say what’s the actual impact on performance metrics. Yes, you can get the metrics from Performance and Network tabs, but considering the huge amounts of different browsers, network connections and devices, it’s practically impossible to get one number.
That doesn’t mean that you shouldn’t do this type of analysis at all. On the contrary. That just highlights the importance of gathering this type of data, because currently some of the scripts you’re loading might have a huge impact on the user experience of some users while the impact might be miniscule for others.
FAQ about embedded Youtube videos impact on page load time
Can this approach be used to check the impact of other embedded resources?
Yes, you can use the same resource blocking approach to test for example the impact of removing a Facebook Pixel or Google Analytics code from the site.
Is there no easier way to find out how much computing resources does the source have?
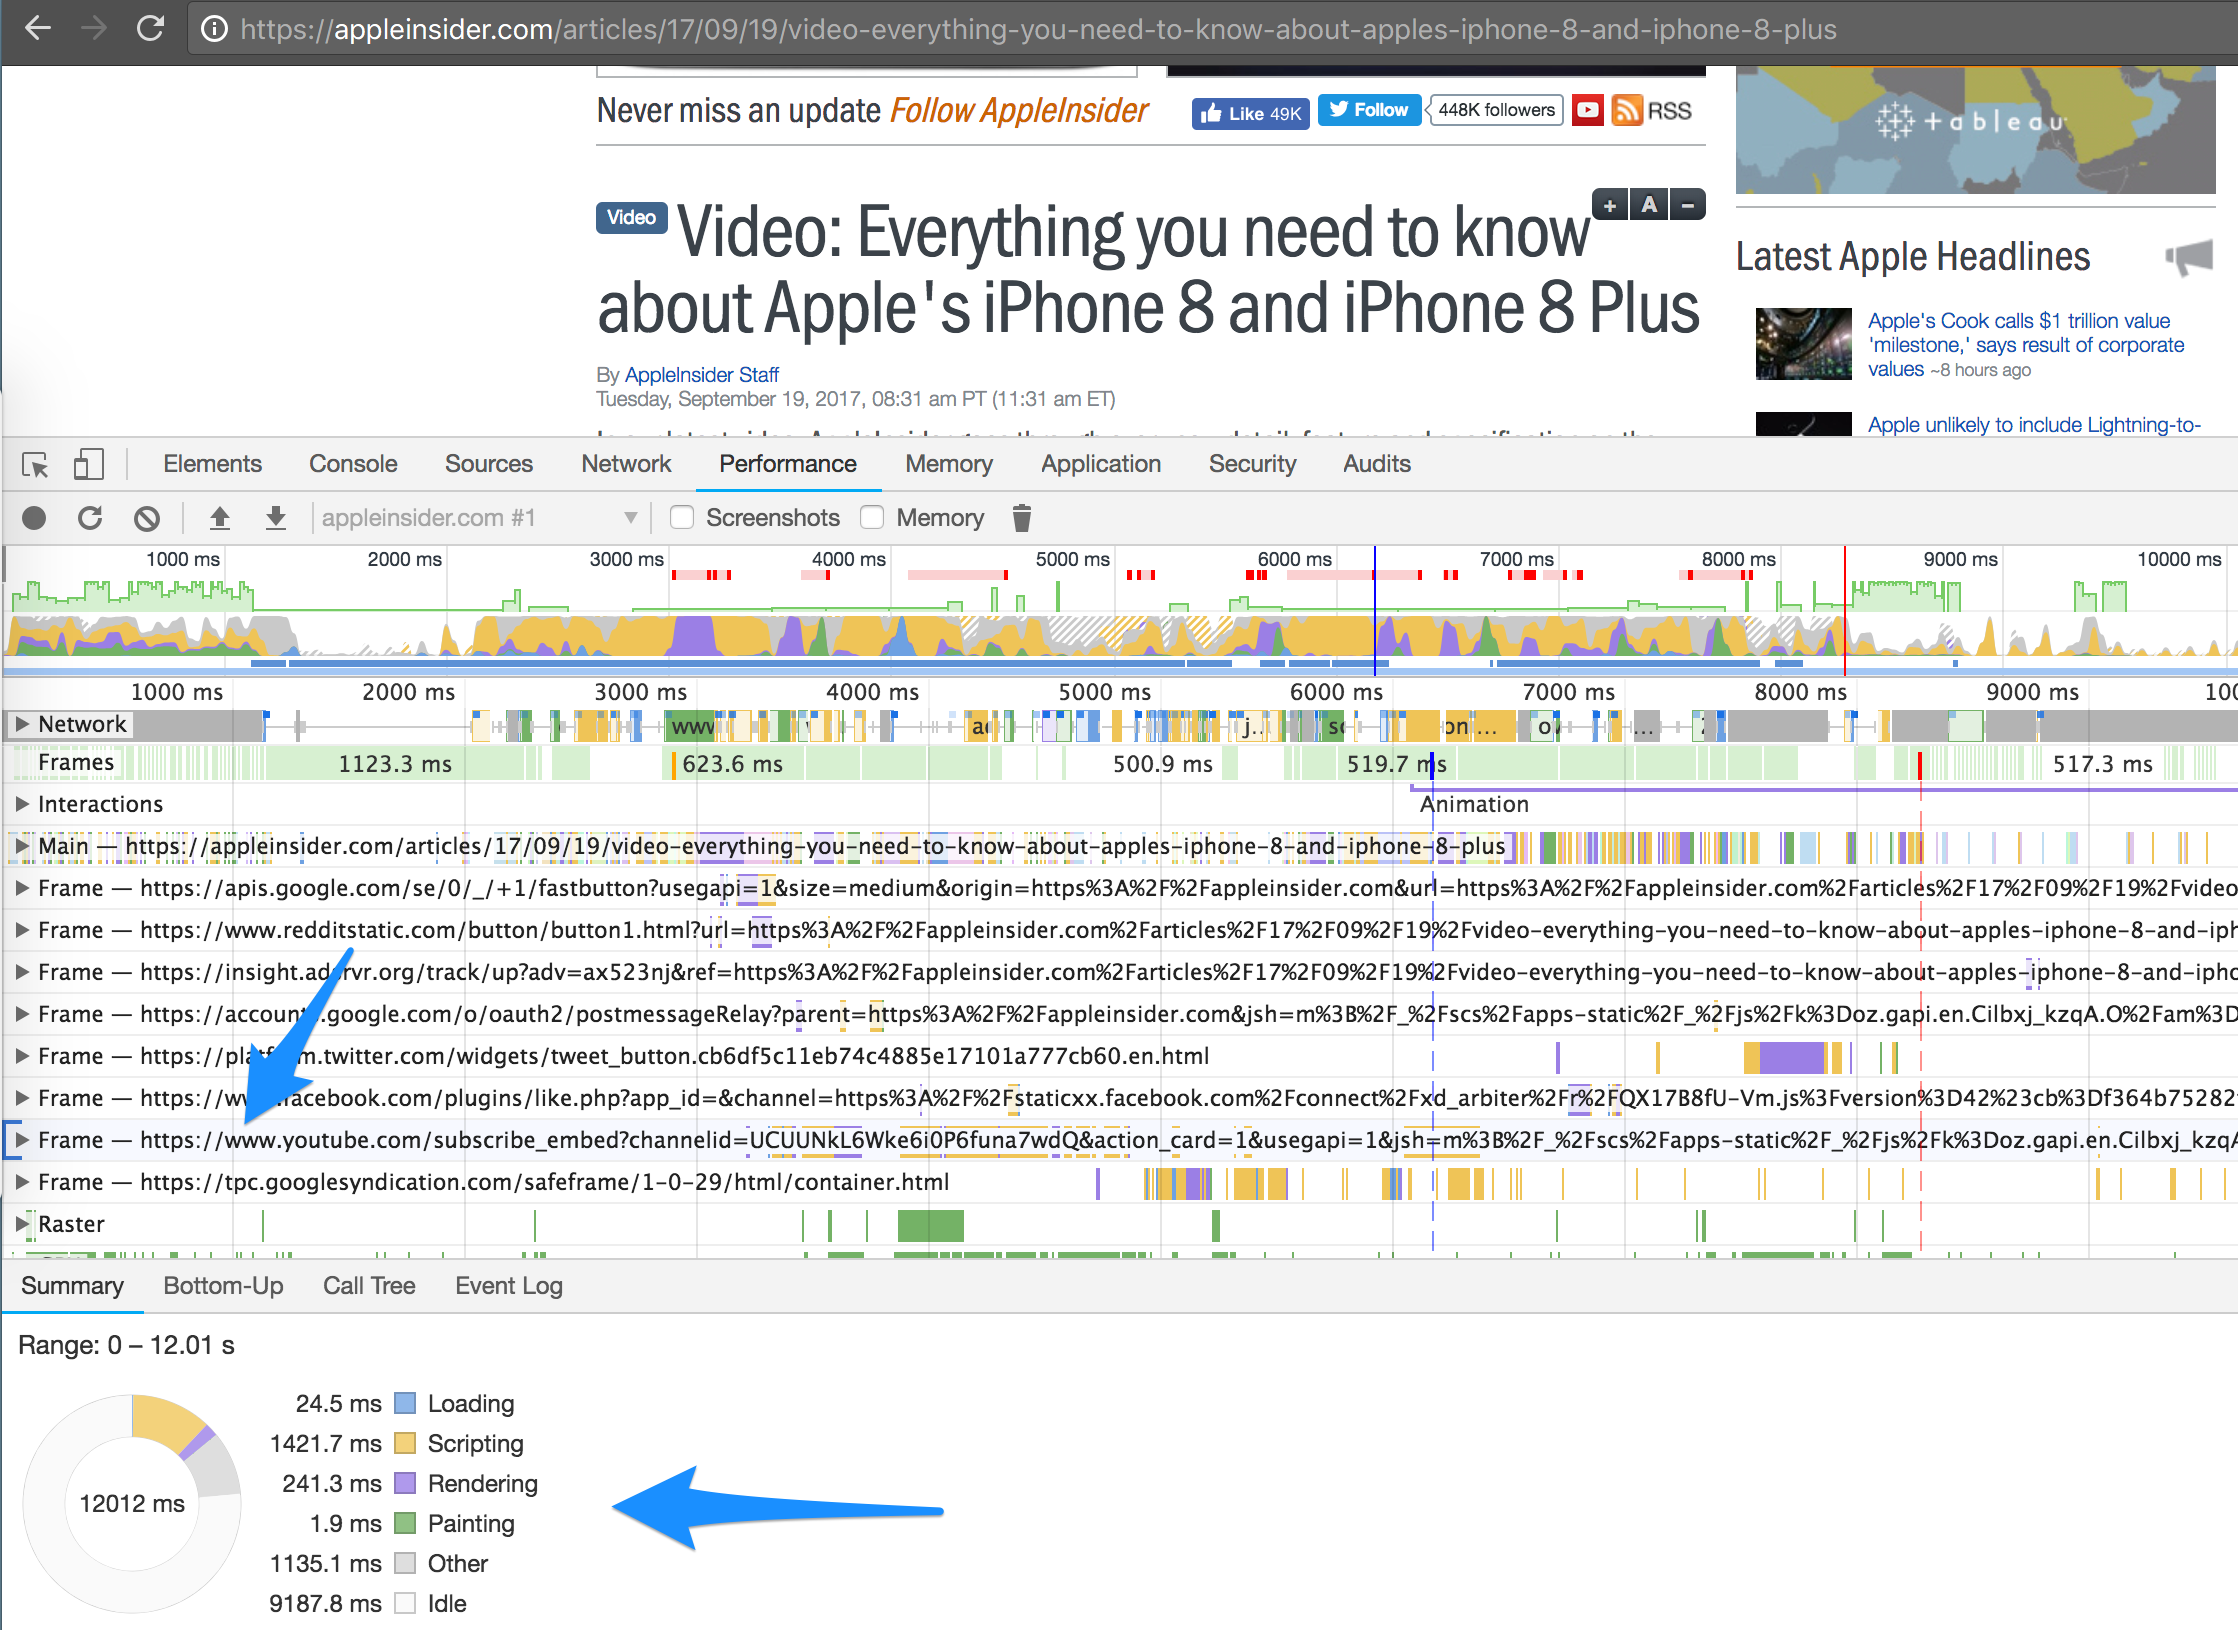
This might not work on every site and regarding every resource, but you can try to see what’s the impact of a script or an embedded resource on page load time by checking the Performance panel on Devtools and then clicking on a frame in the list you see. That should expose the same graph as before but only for that source:
