Your organic CTR might not be what you think it is
Published on: July 28, 2017 by Joona Tuunanen
You know how you see these average organic search traffic click through percentage studies every now and then? They’re often based on a lot of data and fancy statistics.
Today I got a thought to see how well those studies correlate with the customer data of our agency’s clients, as reported by Google Search Console.
I was particularly interested whether or not there’s a difference between industries and between desktop/mobile. I was expecting to see some differences, but honestly wasn’t expecting the types of results I got.
Before diving in to the results, I should probably tell how the data was collected and what limitations it might have:
- All ranking data was collected from 3 of OIKIO’s clients’ Google Search Console. Date range was 16.7.-7.10.2017. The metrics used were average search position and CTR %.
- An obvious limitation is that this is based on only 3 different industries and only one popular website per industry. So take everything in that context.
- I filtered search phrases to only include terms that have received minimum 5 clicks to avoid noise in data.
- All branded terms have been left out of the sample.
- All average position ranking data has been rounded to nearest full number to keep the data comparable. So an average position of 4.7 has turned to 5, as has 5.2 as well.
- Unfortunately I can’t disclose industries in order to protect clients identities. OIKIO’s site has a bunch of our client’s listed and it wouldn’t be too difficult to put 1+1 together should I disclose the industries. All the industries are very competitive.
Now with that out of the way, let’s dive in.
Industry differences in CTR
You can call me naive, but I was surprised to find such huge differences between industries for CTR.
Let’s start with the organic click through rates for desktop:
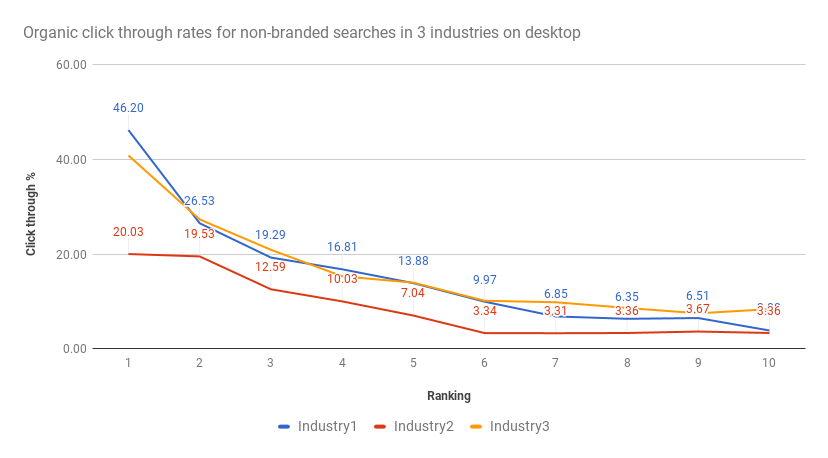
As you can see, there’s a massive difference between the click through rates between industry1 and industry2! Basically no matter where you rank, your organic CTR is going to be much lower for the industry2 compared to the other industries.
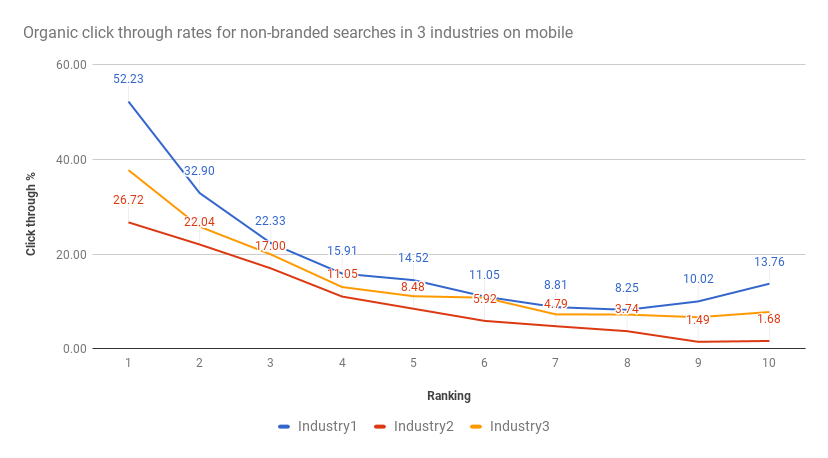
The same difference appears on mobile as well, even if the curves are slightly different as more people seem to prefer top3 positions from the smaller screen:
When I saw this data, my first reaction was “I must have messed something up”, but after going through a careful and comprehensive recalculation of everything I have to admit that everything checks out.
What might cause such huge differences in CTR?
I can’t say for sure, but here are a few possible explanations:
- People are more brand oriented on industry2 as the other two industries. With this I mean that they more or less know the brands they like and trust and go check their sites instead of choosing “randomly” from search results. This is supported by the fact that our client does get a loooot of branded clicks even if they rank well for a lot of industry terms.
- The search behavior is more browsing-type for industry2 than the other industries.
- People click more on ads on industry2 than the other industries. As all the industries are competitive, there’s usually the maximum amount of ads on top of the search results.
- Differences in SERP features, although it must be said that this is not very likely as Google is not that great at understanding Finnish, which means there’s less answer boxes etc.
- Brand perception of our client is not great, which leads to lower CTR’s.
In any case, I find this data interesting and will definitely have to dig in deeper in the coming weeks and months to understand better what’s going on.
Desktop vs mobile click through rates
I was also curious how does the organic click through rates for non-branded terms differ between desktop and mobile searchers. Here’s a nifty graph consisting of average data based on above data:
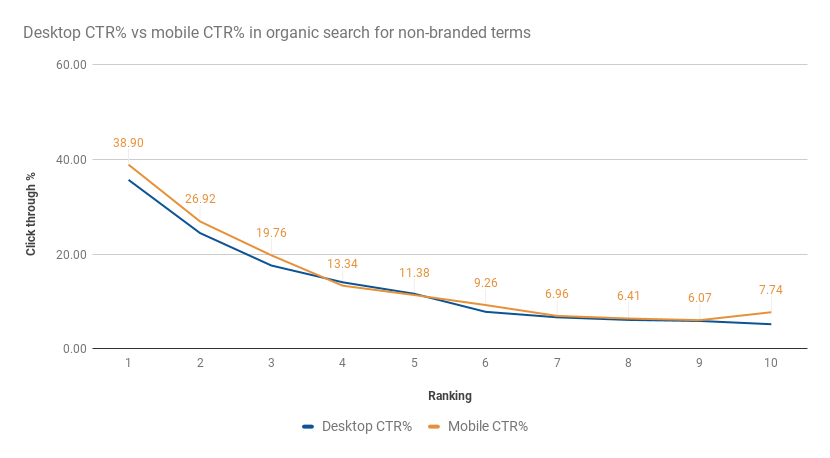
My assumption was that mobile devices do get a higher CTR from organic than desktop, just because “people are too lazy to scroll on mobile”. That assumption was right, but honestly I was expecting a bigger difference between desktop and mobile CTR’s for top3.
Here’s the same data in a table format:
| Ranking | Desktop CTR% | Mobile CTR% |
|---|---|---|
| 1 | 35.69 | 38.90 |
| 2 | 24.47 | 26.92 |
| 3 | 17.60 | 19.76 |
| 4 | 14.06 | 13.34 |
| 5 | 11.64 | 11.38 |
| 6 | 7.83 | 9.26 |
| 7 | 6.67 | 6.96 |
| 8 | 6.12 | 6.41 |
| 9 | 5.90 | 6.07 |
| 10 | 5.21 | 7.74 |
It is however quite amazing how well the graphs align between positions 4 and 9 and basically the CTR is identical for those positions. The difference comes for position 10, but that’s basically an outlier due to surprisingly high CTR’s for industry1 in the graph higher up on this page.
I did of course check the data for industry differences for mobile vs desktop. Those were very similar than the ones showcased in the industry differences section of this blog post, so I omit them from this blog post.
This whole desktop vs mobile would get even more interesting if I could incorporate data how clicks are split between SEPR features, organic and ads. Luckily, Moz just published a post about that so go check it out.
The TL;DR version of that post is “Organic receives 25% less desktop CTR and 55% less mobile CTR compared to two years ago”.
So what should I remember from this post?
Going through this data was really eye-opening experience for me and a great reminder that you should regularly test/verify your assumptions. Especially so when it comes to data that you might use to estimate the impact or potential of SEO.