How to find unused JavaScript and CSS on your site
Published on: August 1, 2018 by Joona Tuunanen
There’s a relatively easy way to find out how much unused JavaScript and CSS a site is loading. To find out what code is not needed for rendering the site, all you need is access to Google Devtools and a bit of time.
But why does this even matter? The browser will need to load all the code just once and it will then cache the code for the following pageviews, right?
Well, the thing is that if your site has too much unnecessary baggage and thus it’s page load time is too long, it’s possible that there won’t be even one pageview. And in any case, it’s good to only use code that you actually need.
To demonstrate how to find this on your lovely Devtools, I’ll use Puma’s ecommerce store’s AC Milan section as an example.
Finding unused JavaScript and CSS
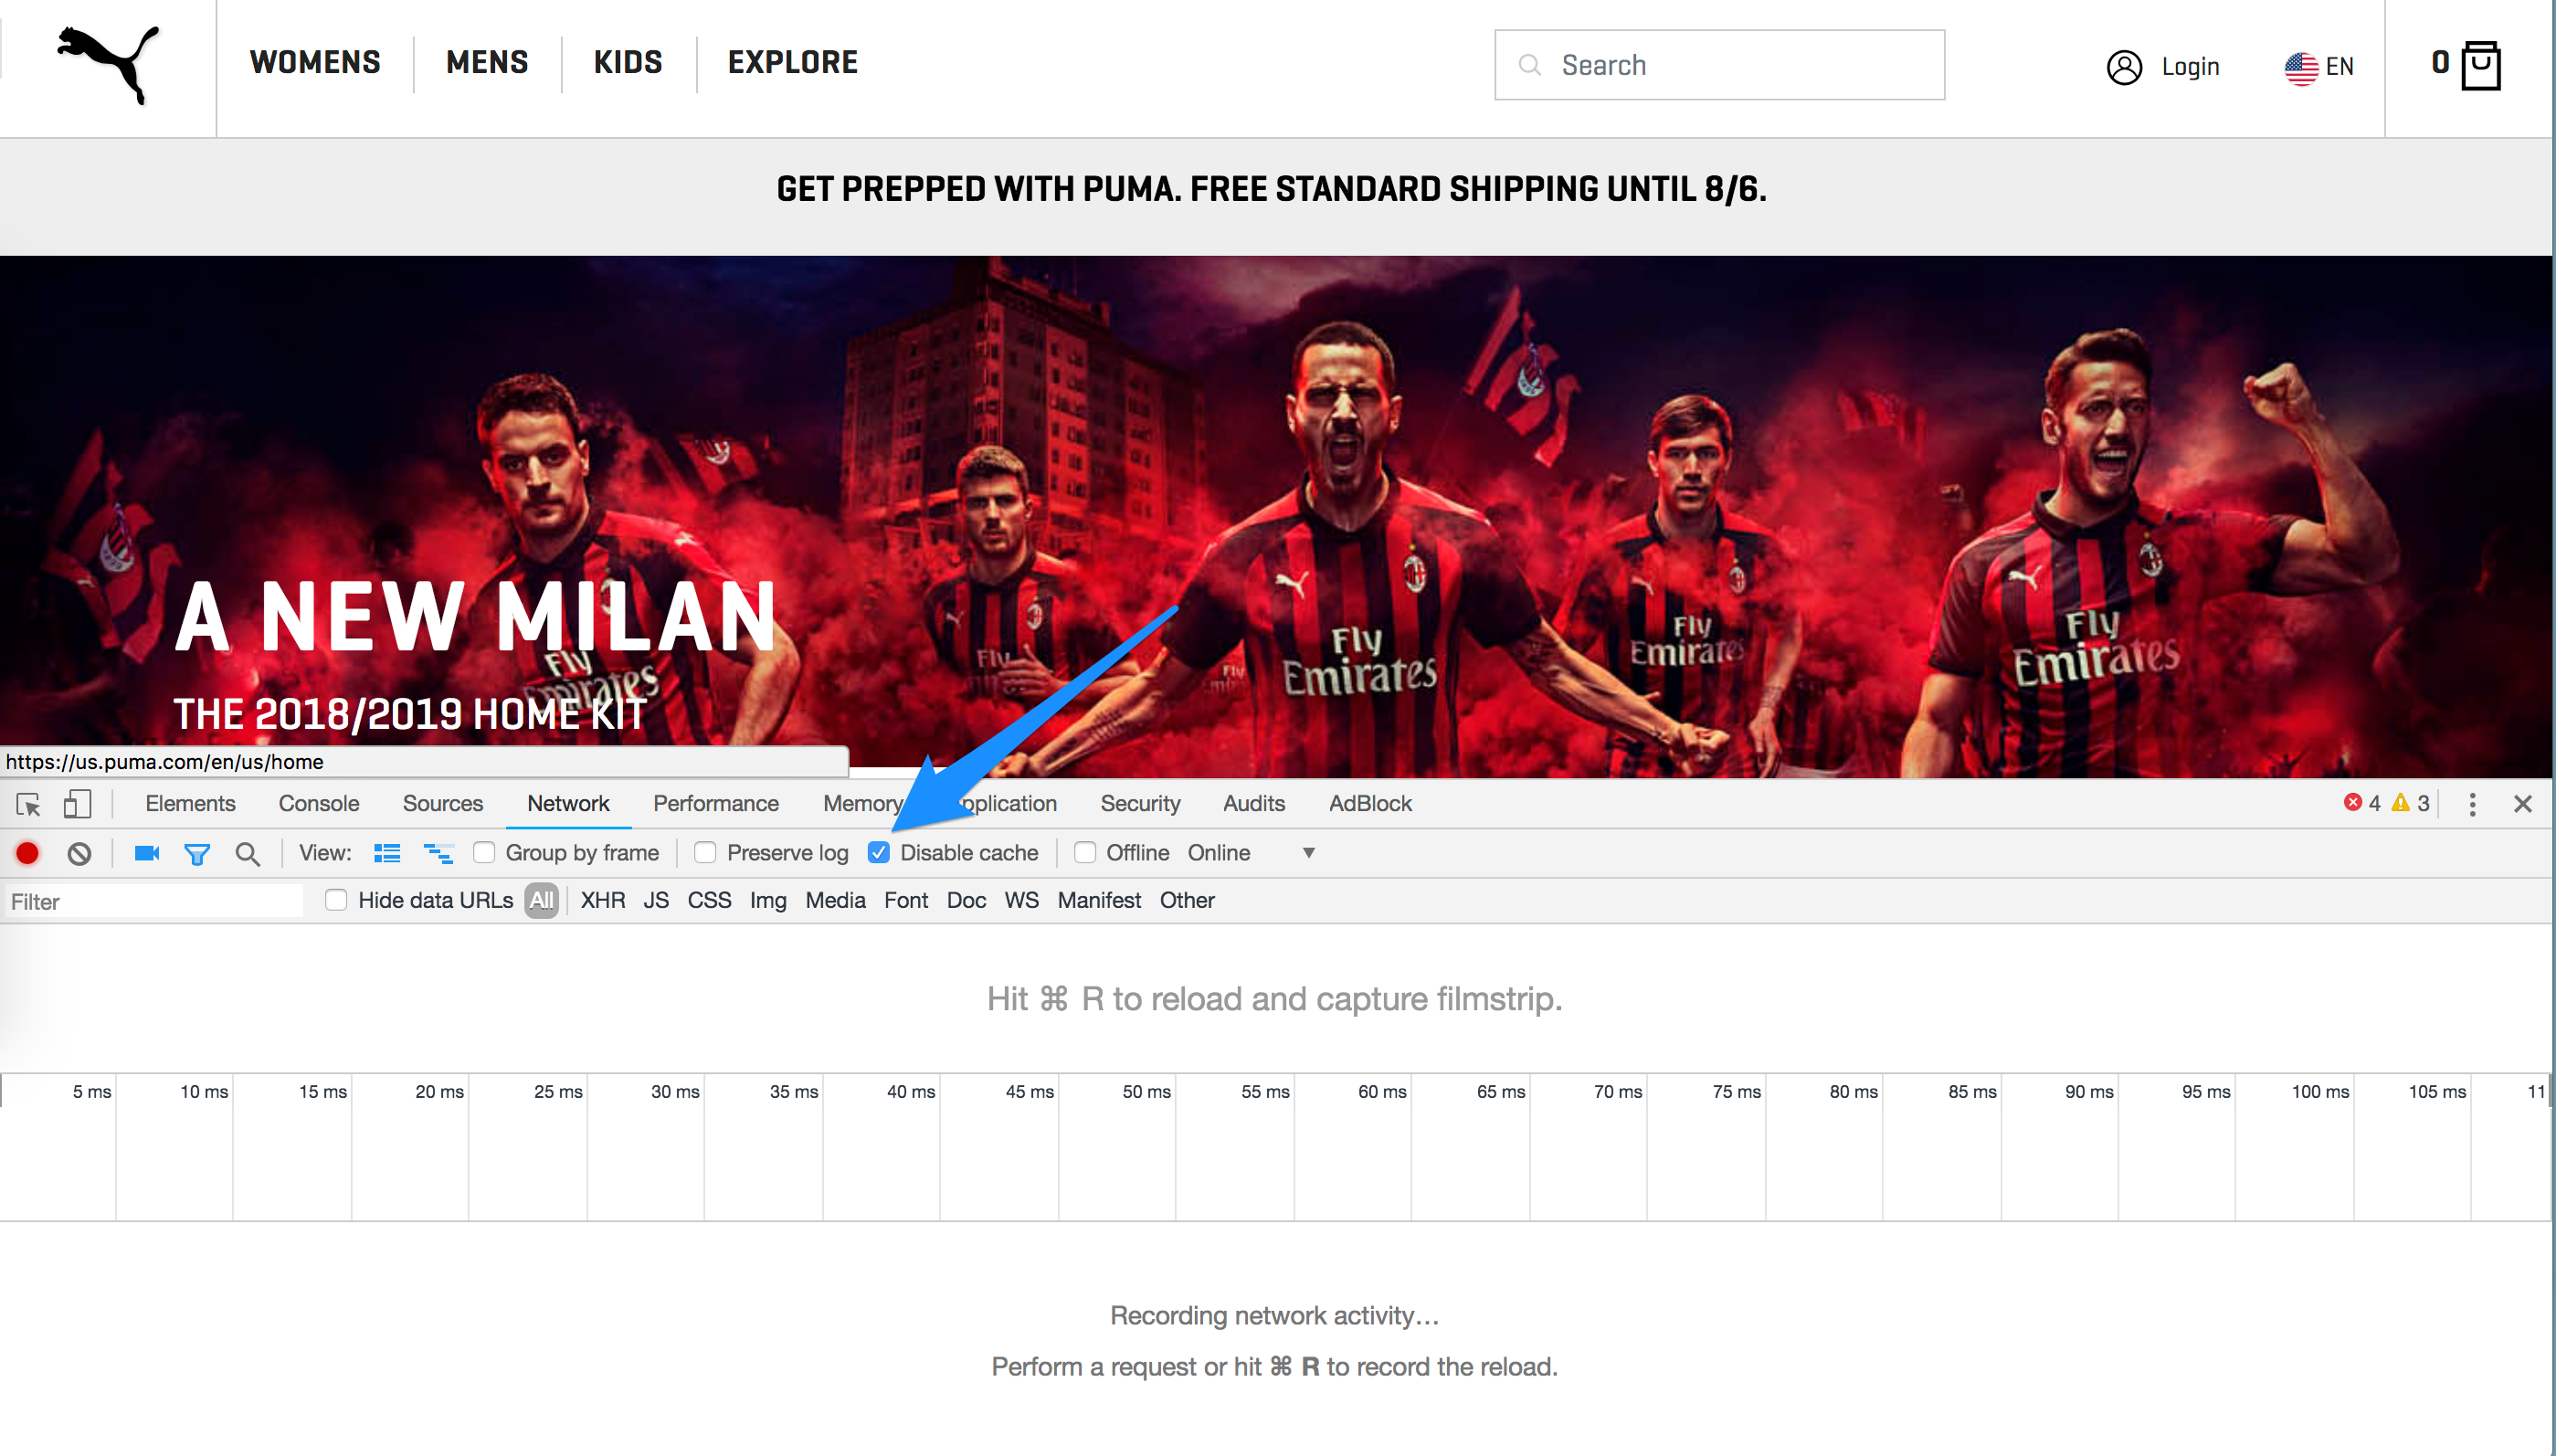
Start by firing up Google Chrome Devtools and navigate to the network panel. You should see something like this:
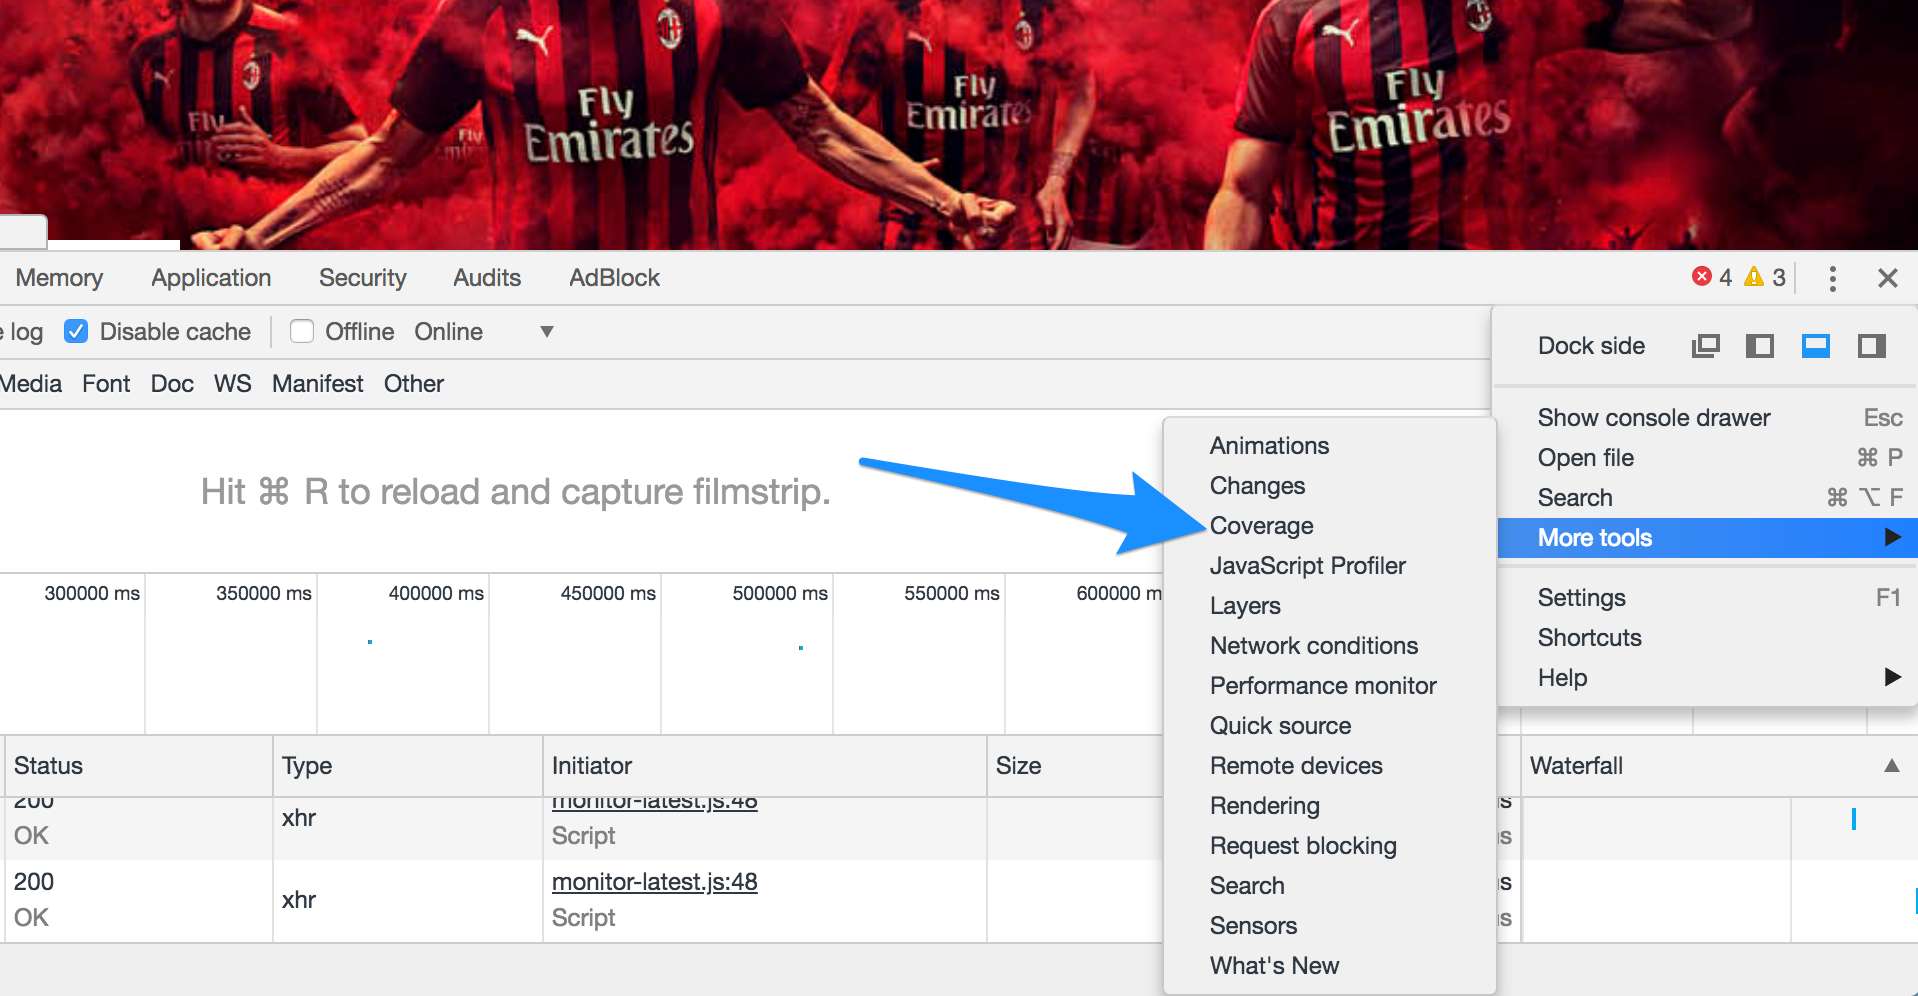
Once there, click on the 3 dots on the upper right corner of your Devtools to expose other options as well. From the menu, you’re looking for a “Coverage” under “More tools” as highlighted below:
You’ll get this additional panel of sorts to the bottom of your Developer Tools view. In it you’ll have two options:
- “Click the record button to start capturing coverage”
- “Click the reload button to reload and start capturing coverage”
Unless you’ve done some modifications to the code you’re running, just click the second option. After doing that, you’ll see something like this:
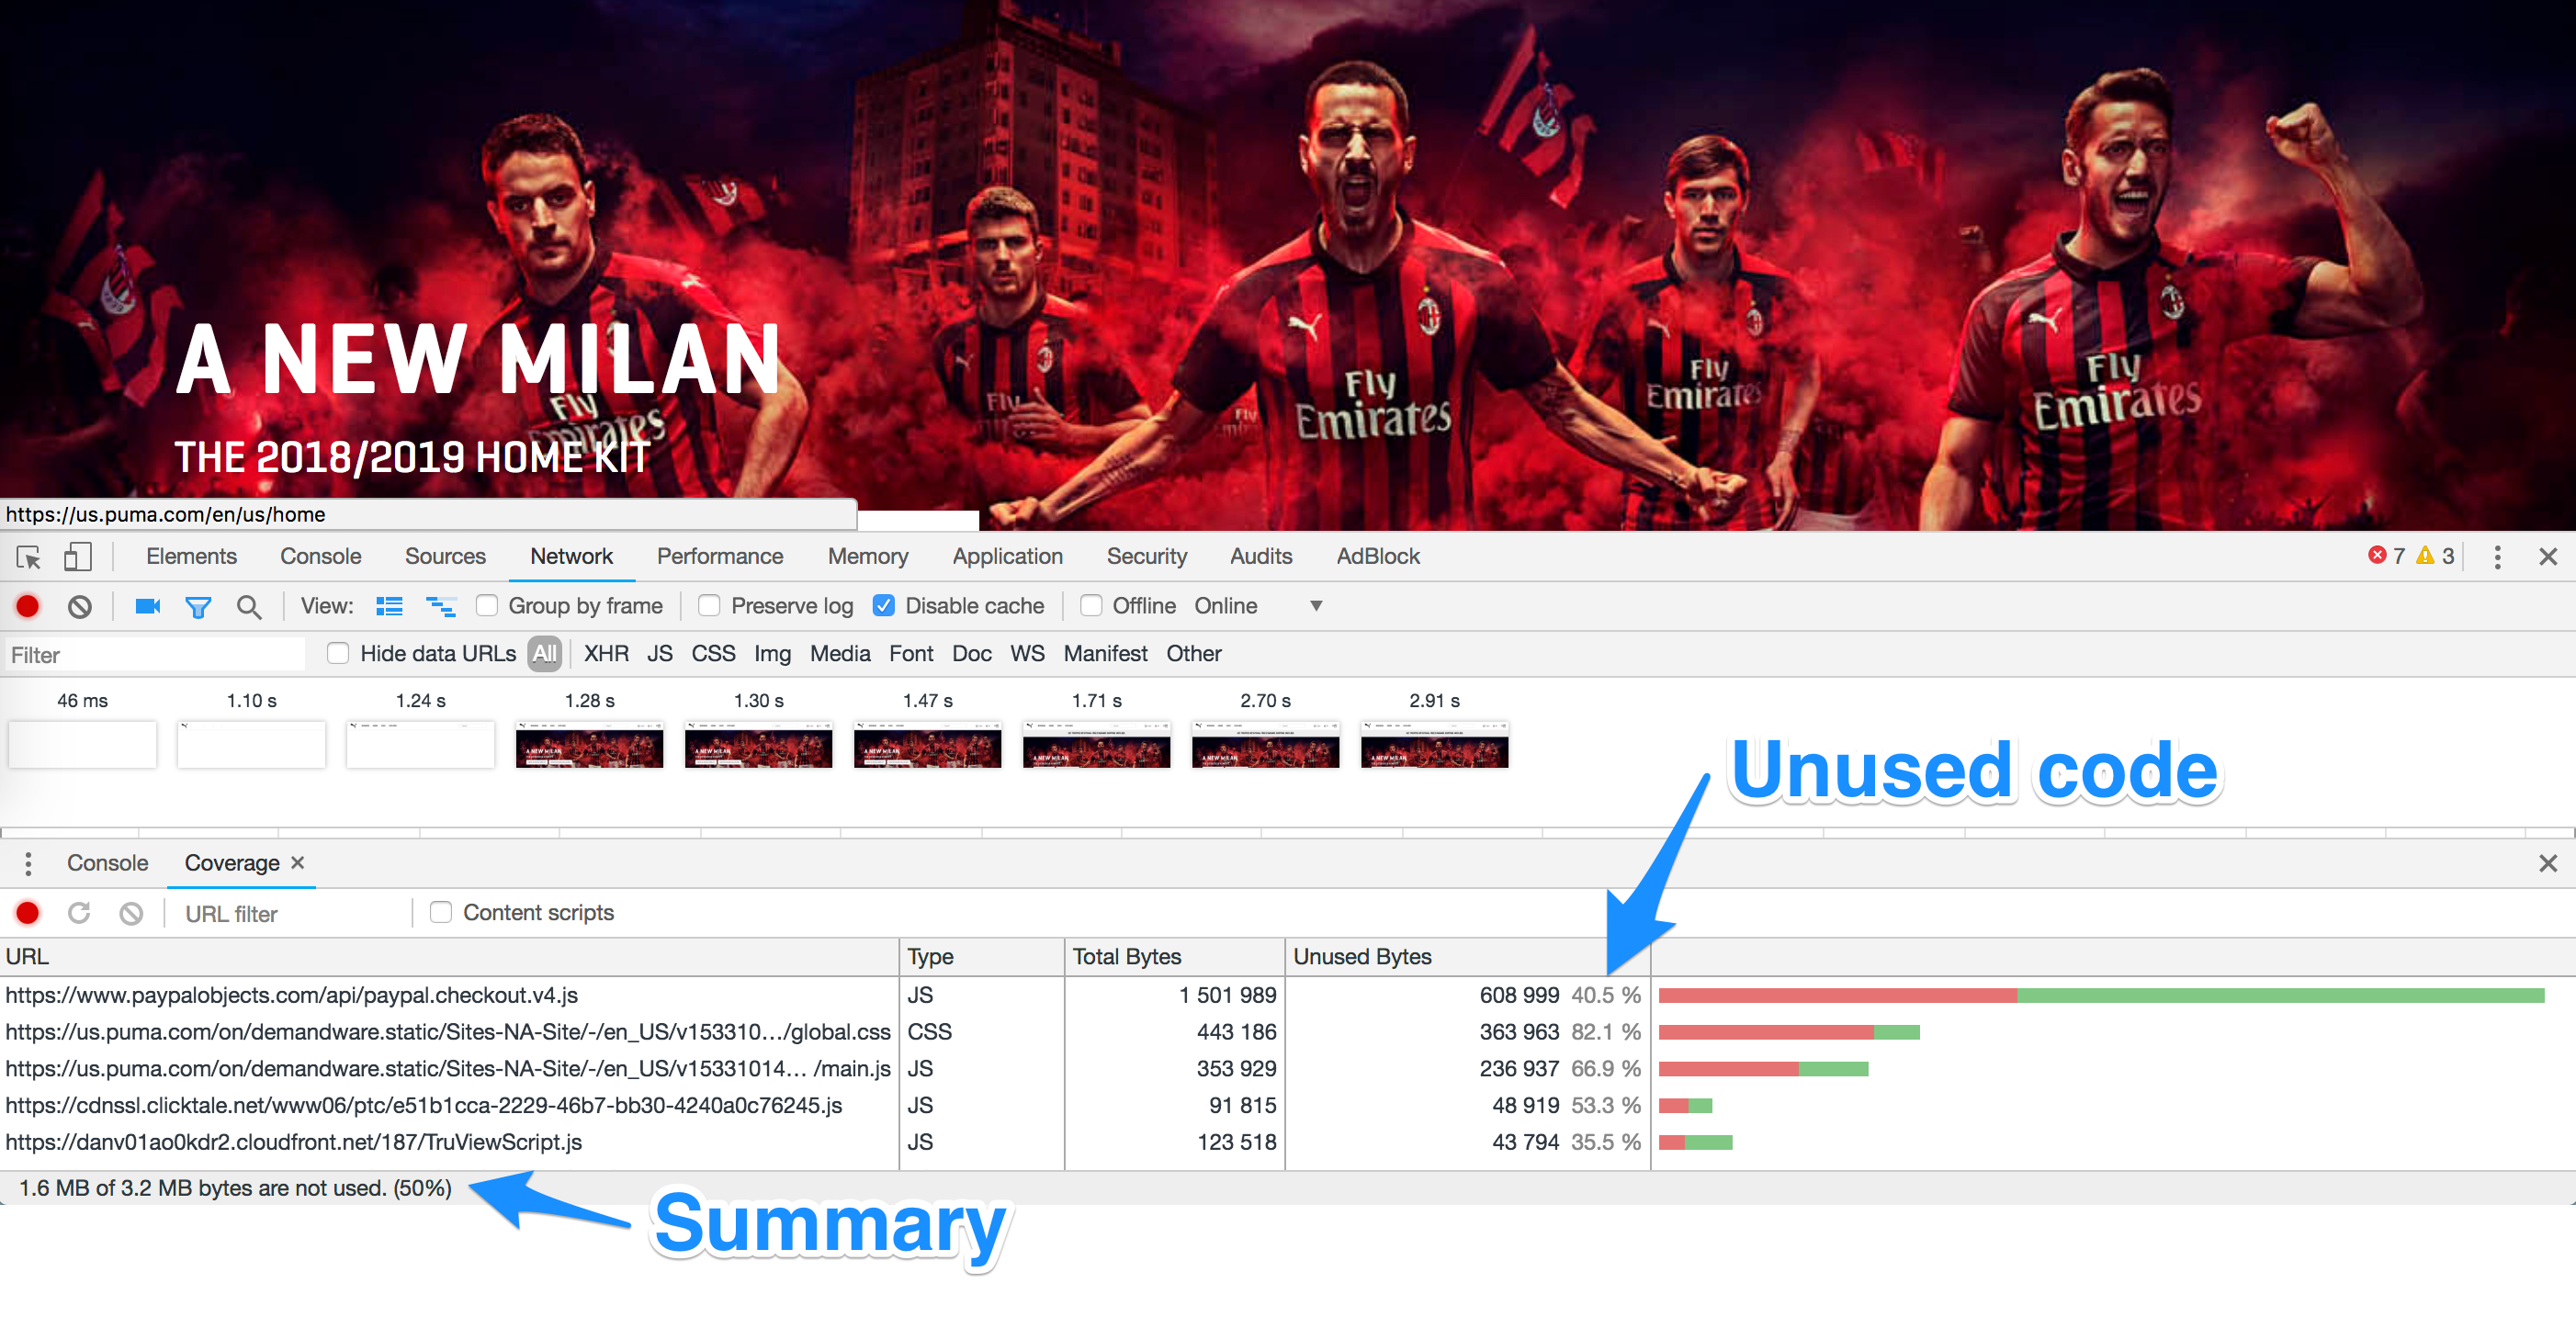
On the bottom left corner you’ll see a summary of all CSS and JS files loaded by your browser and how much of that code was needed to render the page. Sometimes these numbers are really shocking and you’ll see that more than 80% of the loaded JS was not needed even after interacting with the site or that you’re loading 5MB of overall JS code.
You’ll also see a breakdown per file of the amount of code that was used in rendering.
Ok, at this point you might be thinking that “ok, that’s neat and all, but it would be nice to know which part of the code was used, not only a stupid percentage”. Fear not, the good people working on Chrome Developer Tools have thought about this as well and therefore you can actually see the used and unused code.
You just need to double click a file and you’ll see the contents of the upper part of Devtools changing.
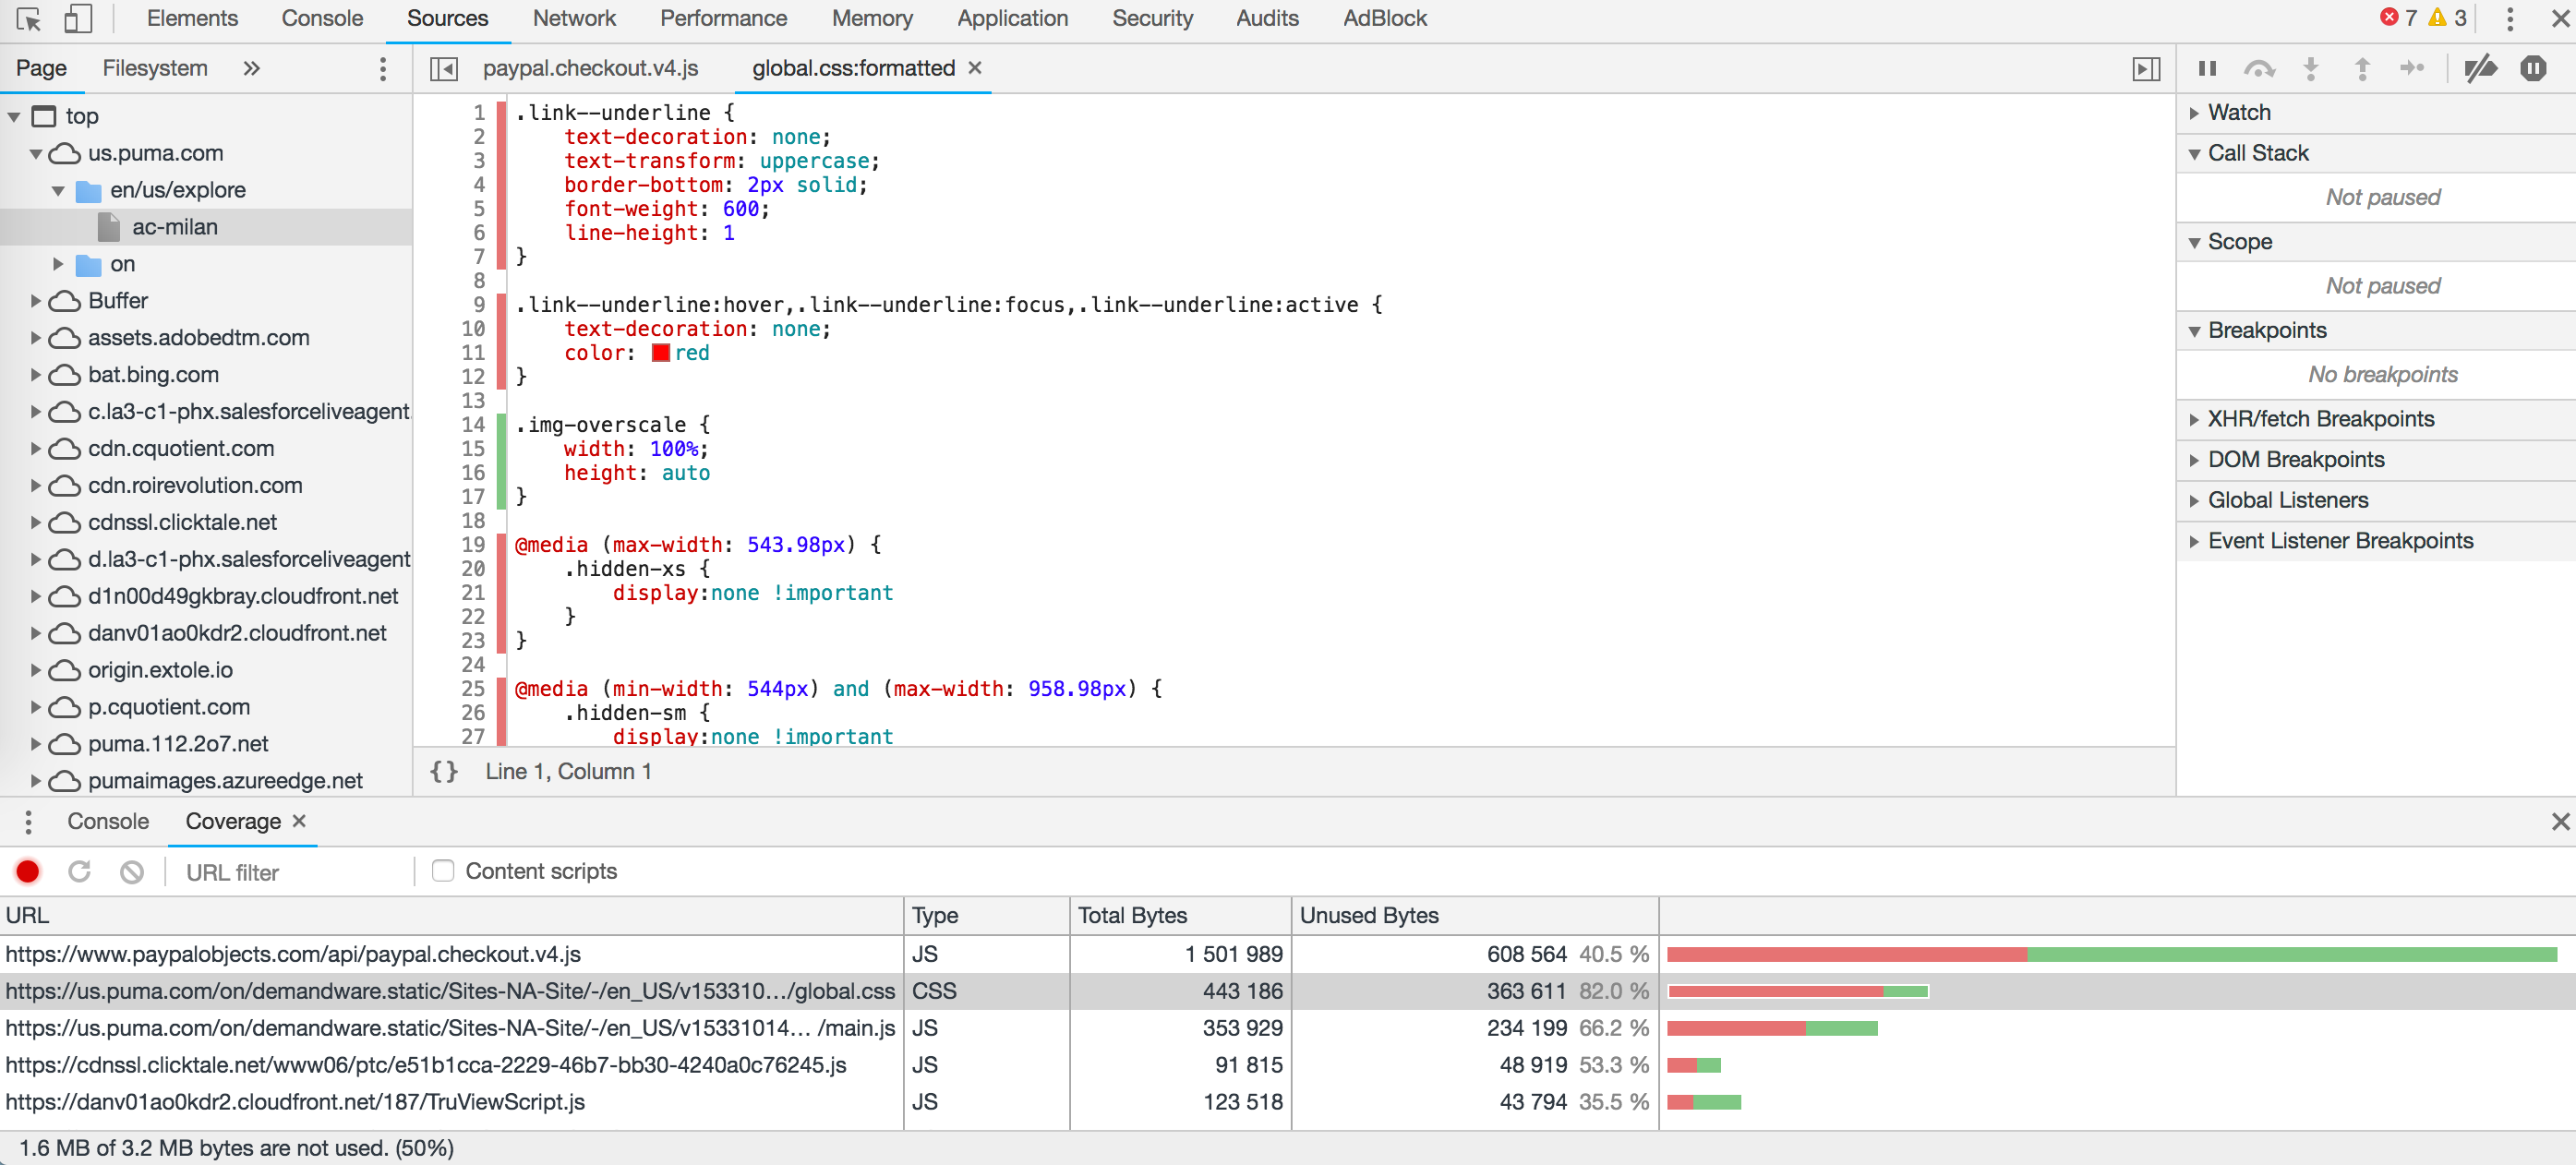
The rows with a red line on the left have not been used to render the page while the ones with green are. This can be a great way to get started with trimming.
What to keep in mind when trimming code
Keep in mind that it’s not wise to just start getting rid of all the elements that Devtools highlights as code that has not been loaded with your pageview. There’s a few very good reasons to use caution while doing this.
Firstly, even if you don’t need all that code to load that particular page, you might still need it to actually make it function. For example, you might have an option to add a product to cart. The code that makes that happen were most likely included into one of those JS files, but it wasn’t needed to render the page. But it’s very much needed to actually being able to add the product to cart and to actually buy it.
Second of all, that code you might have trimmed might be needed on some other page. In the Puma example I’ve highlighted above, we could do a perfect job at eliminating unnecessary code from this category page, but then for example product pages might not work anymore.
You can go around this problem if you use code splitting, ie. split the code to smaller chunks and only load the parts you need to render that particular page.
In the previous screenshot you could see that the global.css file on Puma’s store was overall 443kb of which 81.6% was used to render that page. Imagine if instead of loading global.css Puma would load category-page.css which could be tailored just for those pages. If that’d be done to all biggest files, they’d save quite a lot of bandwidth and speed up the site for users.
Best practices
So, a if you’re looking to trim unused CSS and JS code from your website keep these things in mind:
- Trim the code little be little and test that the page still functions as it should function.
- It might be a good idea to split global files into smaller files per page type (for example one CSS for product pages and another for category pages), but this adds (a bit of) complexity into development.
- Did I mention already that you should test these changes really well.
FAQ’s about code coverage
How much unused code is too much?
There’s no universal limit or rule to this question. “As little as possible and sensible” is probably the best answer. And it doesn’t necessarily make sense to get hung up on the percentages, but be more focused on the amount of code actually loaded.
80% unused JavaScript out of 50kb is still better than 40% unused JS out of 5MB.
If there are many files that have unnecessary code, where should I start from?
This is down to the developers and the time they have available. It probably makes sense to start from those files that have the most unused code in kb’s as that’s where you can make the biggest impact.
However, it also probably makes sense to check if you could reduce the amount of files loaded.
Why is there so much code that’s added but not needed?
A lot of web development relies on plugins, libraries and frameworks created by others. That is smart because it means that you don’t always need to reinvent the wheel when adding functionality to a website or an app. But it also means that you get all the code that was added even if it’s not needed to load your site.
This is especially true for CSS frameworks such as Bootstrap and Materialize.